

Let’s be honest: if you need three logins, two spreadsheets, and a prayer to calculate ROI… you don’t actually know your ROI. And your CFO knows it too.
The real cost of flying blind
When reporting is scattered across Google Ads, Facebook Ads Manager, Shopify, and Excel, here’s what happens:
- Overspending: You keep throwing money at underperforming channels.
- Underspending: You miss where the real growth is hiding.
- Lost credibility: Finance stops believing your numbers.
It’s not just annoying. It’s dangerous. Because in ecommerce, budget follows proof. No proof? No budget.
Why dashboards don’t add up
Point dashboards are like funhouse mirrors: everyone sees a different version of the truth.
🔥 Marketing swears Meta is crushing it.
🤝 Ops swears retention is the real driver.
💰 Finance swears nobody’s numbers line up.
And they’re all right — because the data isn’t unified.
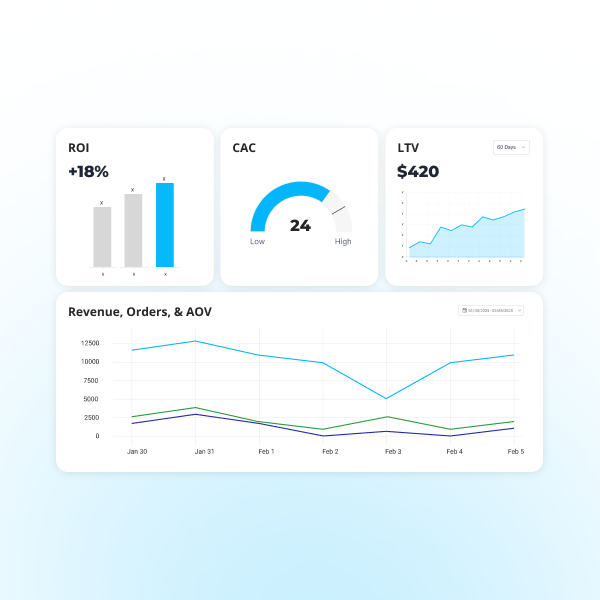
Enter: The one dashboard
Instead of a dozen views and endless debates, imagine a single screen that shows:
- CAC: Exactly what it costs to acquire a customer.
- LTV: What that customer is really worth over time.
- ROI: How each channel contributes to growth.
That’s not reporting. That’s clarity.
How it works in practice
- Ad spend: See Facebook costs tied directly to purchases and repeat orders.
- Channel mix: Compare Google vs. Meta in one clean view.
- Customer value: Track LTV growth without needing three exports and a late-night Excel binge.
It’s the difference between guessing where growth comes from and actually knowing.
The risk of staying blind
Blind ROI kills growth slowly, then all at once:
- You overspend in the wrong places.
- You underspend where growth is real.
- Your CFO starts looking at your budget like a cost center, not an investment.
And once finance loses trust? Good luck getting budget back.
.png)
How to stop flying blind
- Count the logins: If ROI takes three tools, that’s the problem.
- Map the flow: Where do metrics break between marketing, commerce, and service?
- Unify reporting: Pilot a single dashboard tied to one platform.
- Look ahead: Measure CAC vs. LTV for predictive ROI, not just past spend.
The bottom line
Blind ROI isn’t a reporting inconvenience. It’s a growth killer.
One dashboard means proof instead of guesswork. Strategy instead of spin. And finally, a marketing story your CFO will actually buy.
Book a demo of Maropost Unified Commerce today and see what ROI clarity feels like.